Effect of quarantine
Background
From the result of the risk of COVID-19 outbreak in an enclosed environment, it was clear that it is risky to introduce someone to a population directly because he or she might be asymptomatic or pre-symptomatic when being introduced to the population.
It then makes sense to quarantine personnel who will be dispatched to the population, and question is how long the quarantine period should be.
Assumptions
- The enclosed environment has 64 staff, with one carrier of the SARS-CoV-2 virus.
- The carrier was quarantined for a fixed period of time before introduction to the population. He or she will not be dispatched if s/he shows symptom during quarantine.
We are interested in knowning:
- Is 7 day quarantine good enough.
- Is 14 day quarantine good enough to prevent a potential outbreak.
Simulation of outbreaks
This scenario can be simulated with the following command:
outbreak_simulator --popsize 64  --infectors 0 --leadtime asymptomatic --repeats 10000 --handle-symptomatic remove \
  --plugin quarantine 0 --start 0 --duration 7
where
--popsizeis the population size--infectoris the individual with the virus, 0 is its ID.--leadtime asymptomaticmeans the individual could be in any stage of infection, as long as he or she does not show any symptom.--handle-symptomatic removeremoves individuals as soon as he or she shows symptom.--plugin quarantinecalls plugin quarantine
We use default options for other key parameters, which includes
--sympatomatic-r0: production number (average number of individuals an infected individual will infect) from1.4to2.8--asymptomatic-r0: production number of asymptomatic cases from0.28 to0.56`.--prop-asym-carriers: proportion of asymptomatic carriers in a simulation, range from0.2to0.4
outbreak_simulator --popsize 64  --infectors 0 --leadtime asymptomatic --repeats 10000 \
    --handle-symptomatic remove --logfile quarantine_7.log \
    --plugin quarantine 0 --start 0 --duration 7 > quarantine_7.txt
100%|███████████████████████████████████| 10000/10000 [00:07<00:00, 1297.87it/s]
outbreak_simulator --popsize 64  --infectors 0 --leadtime asymptomatic --repeats 10000 \
    --handle-symptomatic remove --logfile quarantine_14.log \
    --plugin quarantine 0 --start 0 --duration 14 > quarantine_14.txt
100%|███████████████████████████████████| 10000/10000 [00:07<00:00, 1345.25it/s]
Results
Distribution of duration of outbreak vs remaining population size
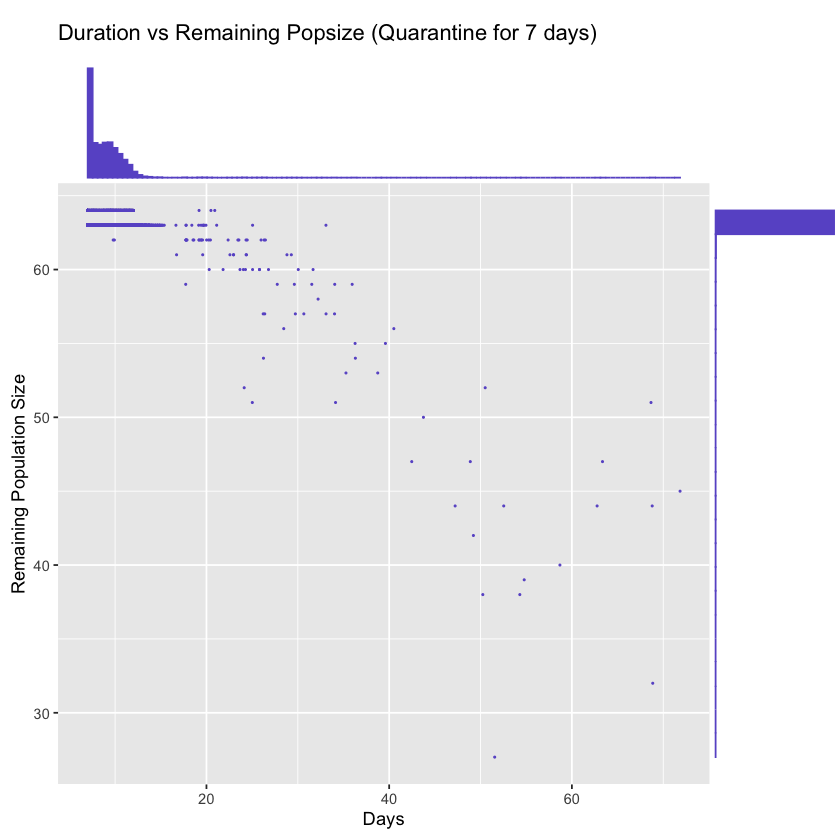
Just to show the overall results of simulations, the following figures display the duration of outbreak (x-axis) vs the remaining population size (y-axis) for a few scenarios.
library(ggplot2)
library(ggExtra)

plot_time_vs_size <- function(data_file, title) {
    data = read.table(data_file, sep='\t', header=1)
    end_count = data[data['event'] == 'END',]
    end_count$target = as.numeric(as.character(end_count$target))

    title = paste0('\nDuration vs Remaining Popsize (', title, ')')

    p <- ggplot(end_count, aes(x=time, y=target)) + geom_point(size=0.2, color='slateblue') + theme(legend.position="none") +
      xlab('Days') + ylab('Remaining Population Size') + ggtitle(title)

    p1 <- ggMarginal(p, type="histogram",
                    xparams=list(bins=120),
                    yparams=list(bins=24),
                    fill = "slateblue",
                    color="slateblue"
                    )
    print(p1)
}
For example, the the first version of the simulation script, there is a clear lognormal shaped distribution for duration of outbreaks, which indicates the first outbreak will happen around 5 days after the introduction of the seed carrier, and there are likely second and third outbreaks.
plot_time_vs_size('quarantine_7.log', 'Quarantine for 7 days')
plot_time_vs_size('quarantine_14.log', 'Quarantine for 14 days')
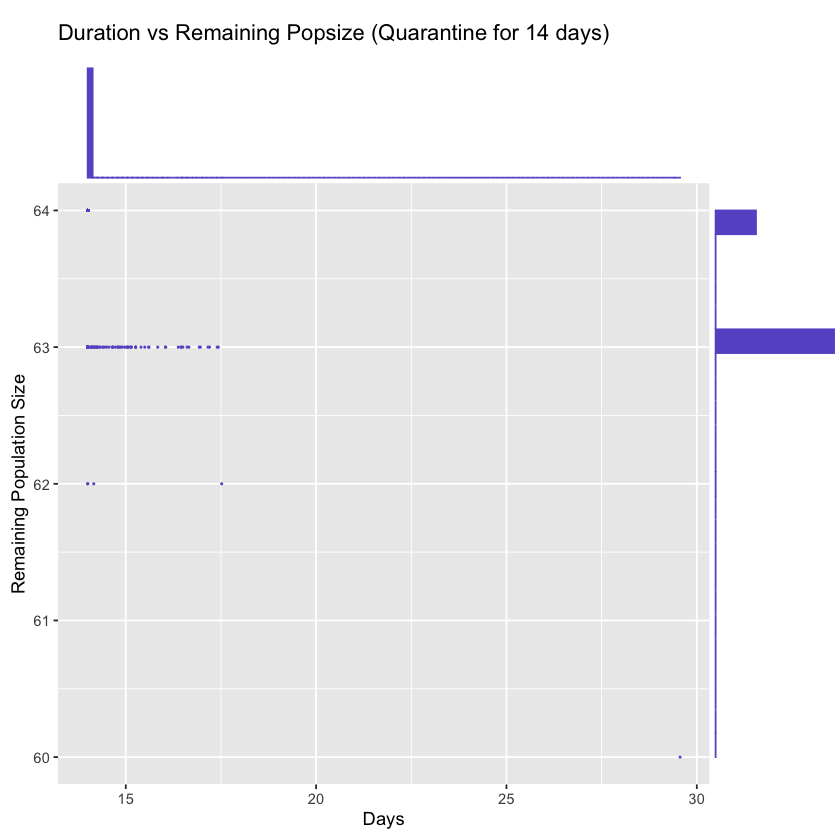
As you can see, there are quite some outbreaks happened after 7-day quarantine. The 14-days quarantine avoided a majority of the outbreaks, but there are still some left. Let us check the details.
The summary statistics of 7-day quarantine is in quarantine_7.txt.
7-day quarantine
Out of 10000 simulations, 7199 people showed symptoms during quarantine and were not introduced to the population. 2801 were introduced to the population. However, a majority of them were asymptomatic cases and were less infectious than symptomatic cases. Even for pre-symptomatic cases who were highly infectious, their duration of infectivity have been significantly shortened due to the quarantine. In the end, an outbreak, defined for simulations with ending population size less than or equal to 62, happened in 0.87% of the simulations.
14-day quarantine
After 14-day quarantine, 2801 individuals were introduced to the population, a majority of them should be asymptomatic cases. In the end, outbreaks happened in 0.87% of the simulations.
If we examine the cases in detail, one of the symptomatic cases had an extra-long incubation period (16 day) so he showed symptom 2 days after he was introduced to the population and have already infected another person.
Availability
This notebook is available under the Applications directory of the GitHub repository of the COVID19 Outbreak Simulator. It can be executed with sos-papermill with the following parameters, or using a docker image bcmictr/outbreak-simulator-notebook as described in here.