Outbreak in a non-enclosed and heterogeneous population
Background
The FPSO example we have simulated represents an enclosed environment in which the introduction of virus could be stricly controlled. However, most factories are not enclosed and would be exposed to surrounding communities and be at the risk of injection of virus.
This project simulates a factory with a on-going COVID-19 outbreak, complicated by the flow of workers with its surronding communities.
Assumptions
- There are 20000 workers and 2000 contractors in the factory
- An outbreak is happening with an incidence rate of 0.002 and population seroprevalence of 0.05.
- Ten contractors will arrive at the factory, and on average 10% of them carries the SARS-CoV-2 virus. The carrier can be pre-symptomatic or asymptomatic.
- Workers are generally young and fit and are less susceptible than contractors, this is reflected by susceptibility coeffients 0.9 and 1.1 for two different groups. We also assume that contractors are more infectious than workers because they are in contact with more people in the factory.
Simulation
The simulation is performed by the following command
outbreak_simulator -j1 --rep 10 --stop-if 't>60' \
  --popsize worker=20000 contractor=2000 --handle-symptomatic quarantine \
  --susceptibility worker=0.9 contractor=1.1 \
  --symptomatic-r0 worker=0.9 contractor=1.1 \
  --asymptomatic-r0 worker=0.9 contractor=1.1 \
  --logfile nonenclosed.log \
  --plugin stat --interval 1 \
  --plugin insert contractor=20 --prop-of-infected 0.1 --leadtime asymptomatic --interval 1 \
  --plugin remove contractor=20 --interval 1\
  > nonenclosed.txt
100%|███████████████████████████████████████████| 10/10 [01:09<00:00, 6.91s/it]
where
--poopsizespecifies number of workers and contractors--susceptibility,--symptomatic-r0,--asymtpmatic-r0specifies relative susceptibility and infectibity for workers and contractors.- Plugin
statreports statistics for the entire population and for workers and contractors - Plugin
insertinserts 10 contractors to the population everyday with10%of them carrying the virus.
Results
Although a large number of statistics such as number of affected, recovered, seroprevalence in contractor and workers are reported, we extract the following statistics from the output of the simulations (nonenclosed.txt) for this report:
avg_contractor_incidence_rate_0.00toavg_contractor_incidence_rate_90.00as incidence rate among contractors for 10 replicate simulations.avg_worker_incidence_rate_0.00toavg_worker_incidence_rate_90.00as incidence rate among workers for 10 replicate simulations.
import pandas as pd
def get_seq(filename, field_name):
    result = {}
    with open(filename) as stat:
        for line in stat:
            if line.startswith(field_name):
                key, value = line.strip().split('\t')
                t = int(key[len(field_name)+1:].split('.')[0])
                #if ':' in value:
                #    value = eval('{' + value + '}')
                #else:
                #    value = {idx+1:value for idx, value in enumerate(eval(value))}
                value = eval(value)[0]
                result[t] = value

    #return pd.DataFrame(result).transpose()[[x for x in range(1, 101)]]
    return result
avg_contractor_incidence_rate = get_seq('nonenclosed.txt', 'avg_contractor_incidence_rate')
avg_worker_incidence_rate = get_seq('nonenclosed.txt', 'avg_worker_incidence_rate')

avg_incidence_rate = pd.DataFrame({
    'contractor_incidence_rate': list(avg_contractor_incidence_rate.values()),
    'worker_incidence_rate': list(avg_worker_incidence_rate.values()),
    },
    index=list(avg_contractor_incidence_rate.keys())
)
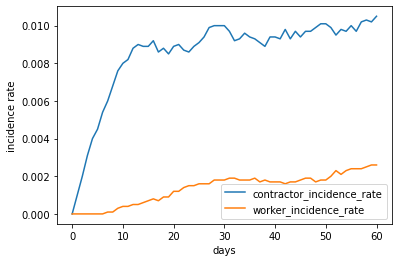
The following figure shows the change of incidence rate for 10 replicate simulations. The population does not have any case from the beginning until the incoming contractors brought the virus to the worker population. The contractors are the source of infection and are more susceptible so the incidence rate among contractors were always higher than that of the workers.
avg_incidence_rate.plot(xlabel='days', ylabel='incidence rate')
Availability
This notebook is available under the Applications directory of the GitHub repository of the COVID19 Outbreak Simulator. It can be executed with sos-papermill with the following parameters, or using a docker image bcmictr/outbreak-simulator-notebook as described in here.