Post-simulation data analysis
Because all the events have been recorded in the log files, it should not be too difficult forconfig
you to write your own script (e.g. in R) to analyze them and produce nice figures. We however
made a small number of tools available. Please feel free to submit or own script for inclusion in the contrib
library.
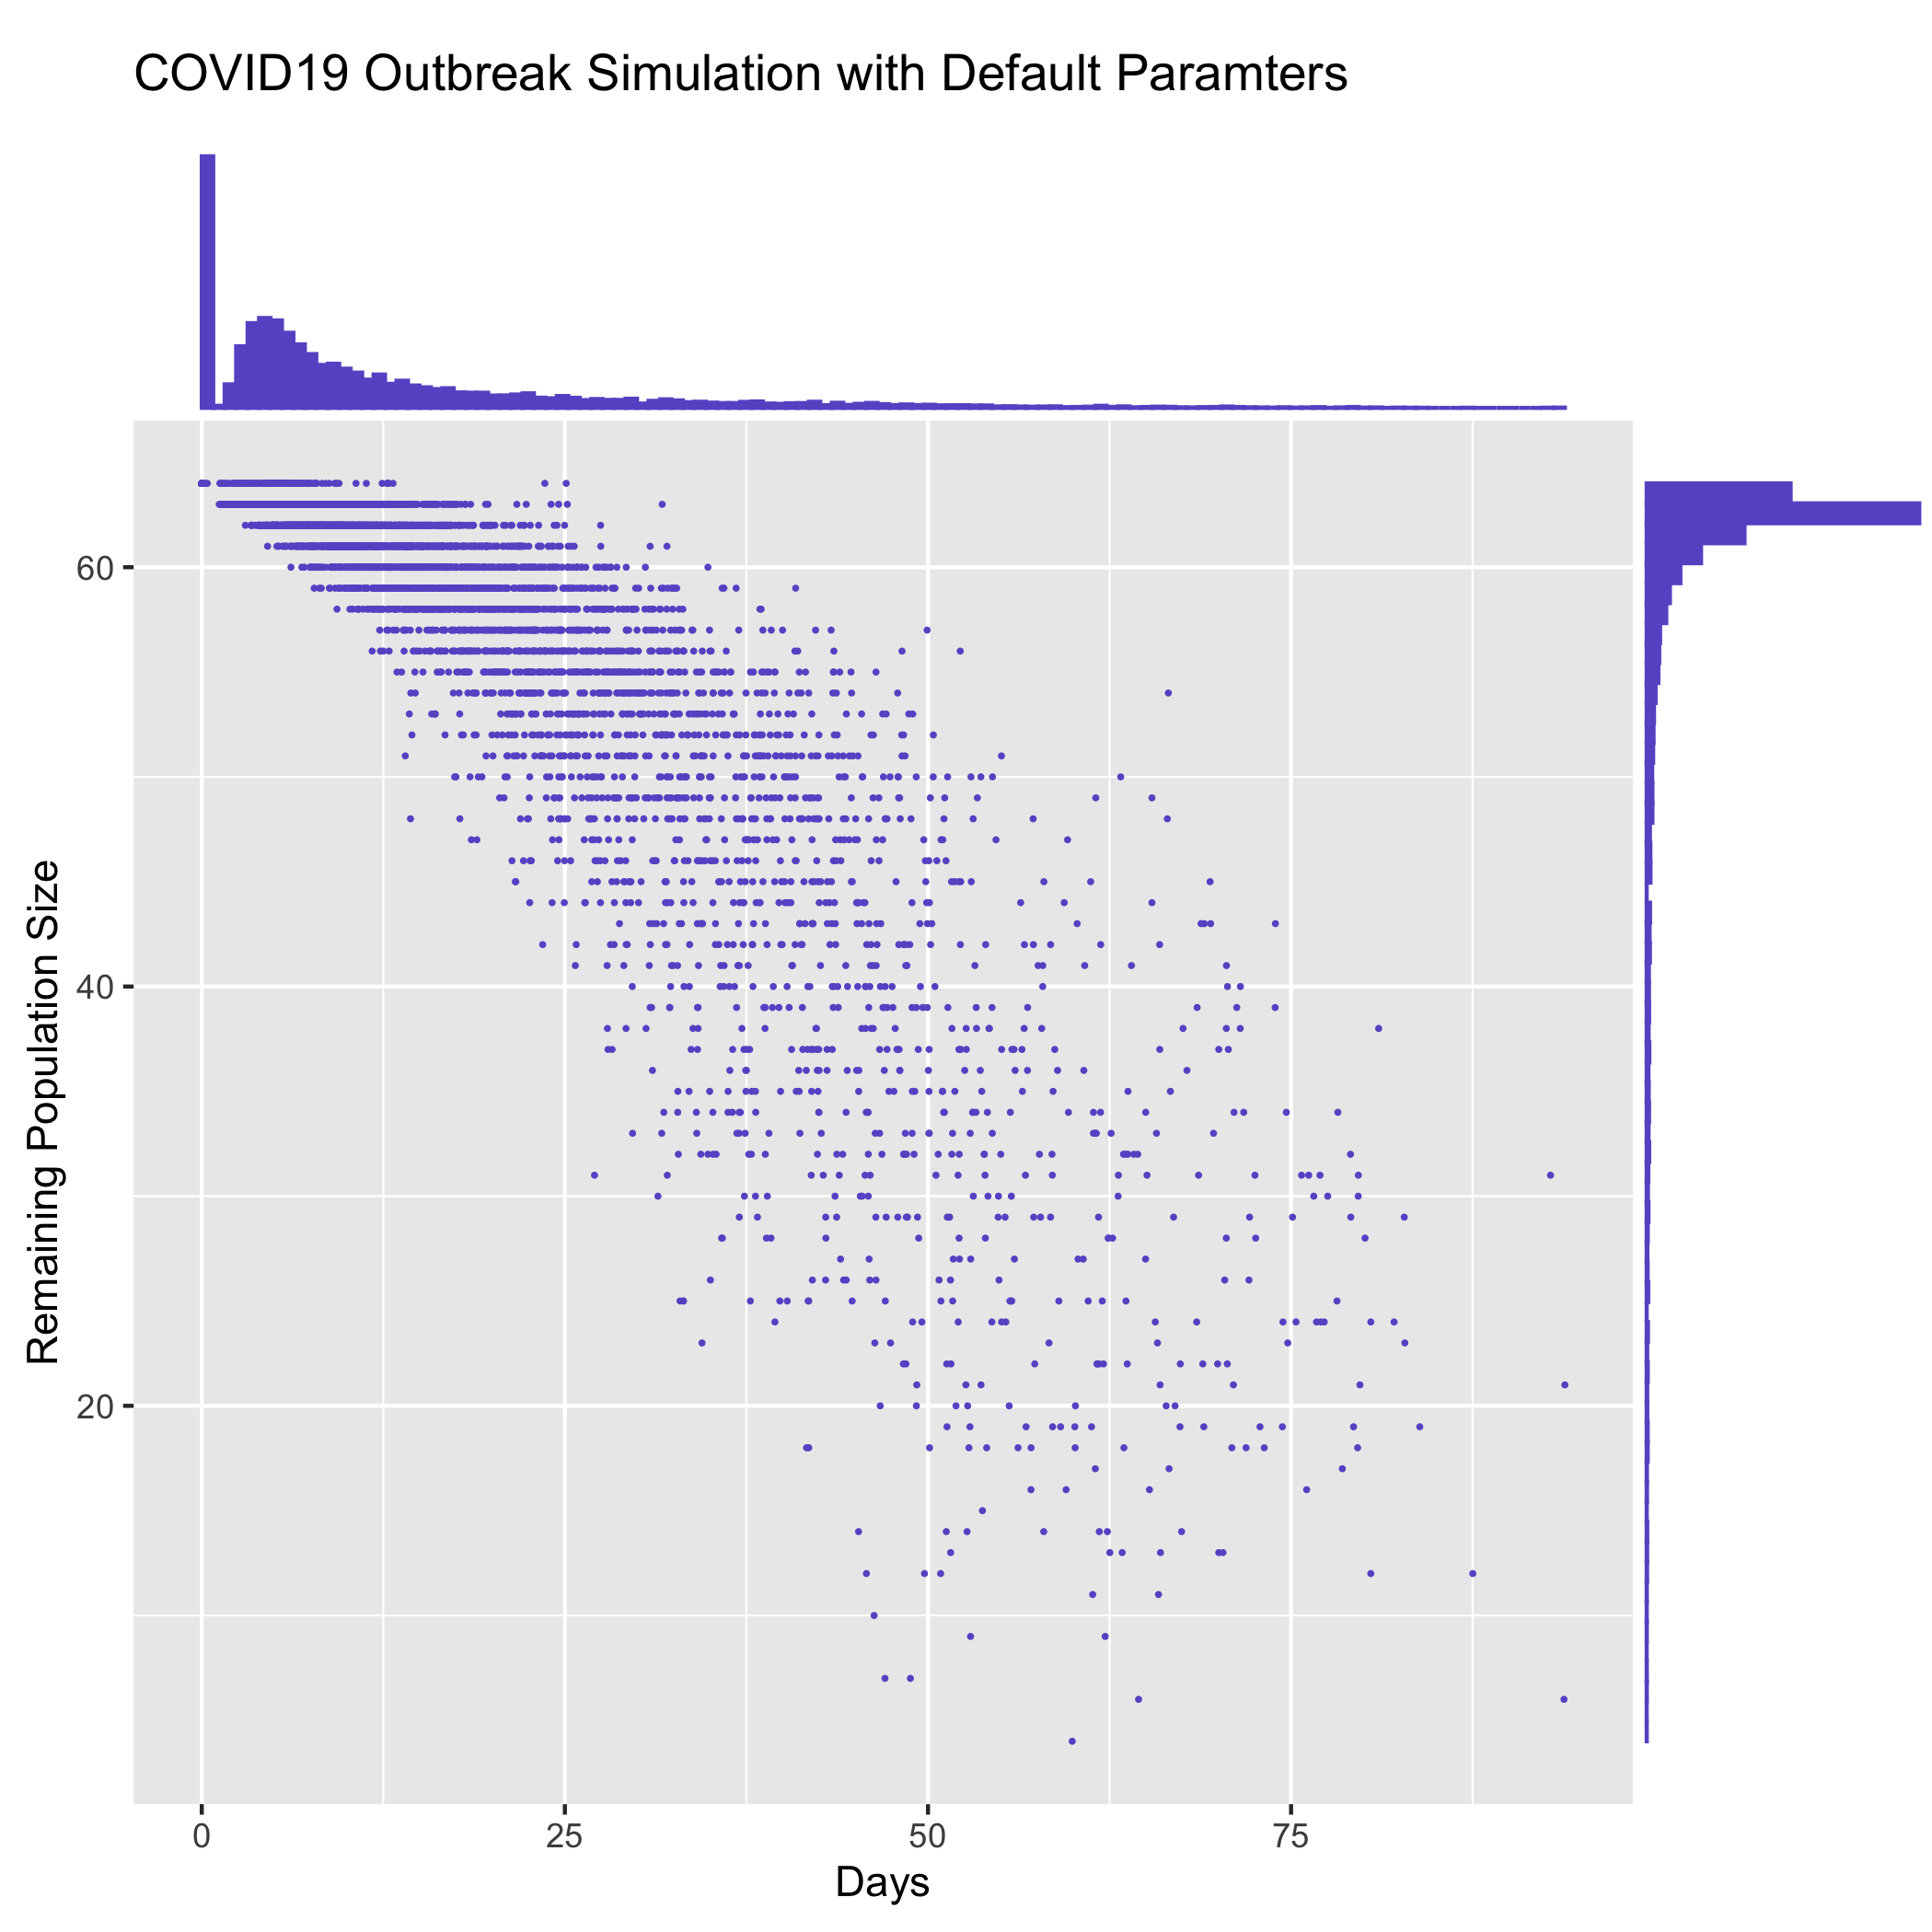
Plot duration vs remaining population size for multiple replicates
The contrib/time_vs_size.R script provides an example on how to process the data and produce
a figure. It can be used as follows:
Rscript time_vs_size.R simulation.log 'COVID19 Outbreak Simulation with Default Paramters' time_vs_size.png
and produces a figure
Merge summary reports from multiple runs
contrib/merge_summary.py is a script to merge summary stats from multiple simulation runs.
Convert summary report to csv format
contrib/report2csv.py converts time-stamped statistics in the report generates from the
simulator to a csv format. It can be called as
output_simulator OPTIONS | python contrib/report2csv.py
or be applied to output saved to a file
python contrib/report2csv.py OUTPUT
The output is by default written to standard output, but can be specified with option
--output. Option --seps can be used to specify delimiter of the output.